Gentrification study of New York and Los Angeles metropolitan areas
Problem Statement
Gentrification drives investment and economic growth in urban neighborhoods but often results in the displacement of low-income residents and communities of color due to rising housing costs and property taxes. We hypothesize that the drivers of gentrification can be broadly categorized into three areas: people, place, and policy. To explore this, we analyzed two major metropolitan areas - New York and Los Angeles.In addition, we developed machine learning algorithms that can be used to identify neighborhoods at risk of gentrification and communities most vulnerable to displacement, intending to inform more equitable and data-driven urban development strategies.
Engineering: Data
Neighborhood Change Database (NCDB). A powerful feature of the NCDB is its ability to match tracts across all five census years, enabling users to examine changing tract characteristics between 1970 and 2010.
We selected the following two regions for our analysis: New York-Northern New Jersey-Long Island, NY-NJ-PA Metropolitan Statistical Area (MSA), and Los Angeles-Long Beach-Santa Ana, CA Metropolitan Statistical Area (MSA)
We chose to study the process of gentrification between the years 2000 and 2010. To do so, we use different variables from the year 2000 as predictors (X) and create the labels (Y) as ‘Gentrified’ (1) or ‘Not Gentrified’ (0) based on 2010 indicators.
We used the following definition to identify if a tract is gentrified or not in the year 2010:
Δmedian household income > Δmedian household income of MSA
Δ% college educated > Δ% college educated of MSA
Δmedian gross rent > Δ% median gross rent of MSA
(OR)
Δ% increase of home value > Δ% increase of home value of MSA
Resulting Data Composition
New York: 990 tracts gentrified, 3522 tracts not gentrified
Los Angeles: 583 tracts gentrified, 2343 tracts not gentrified
Engineering: Data
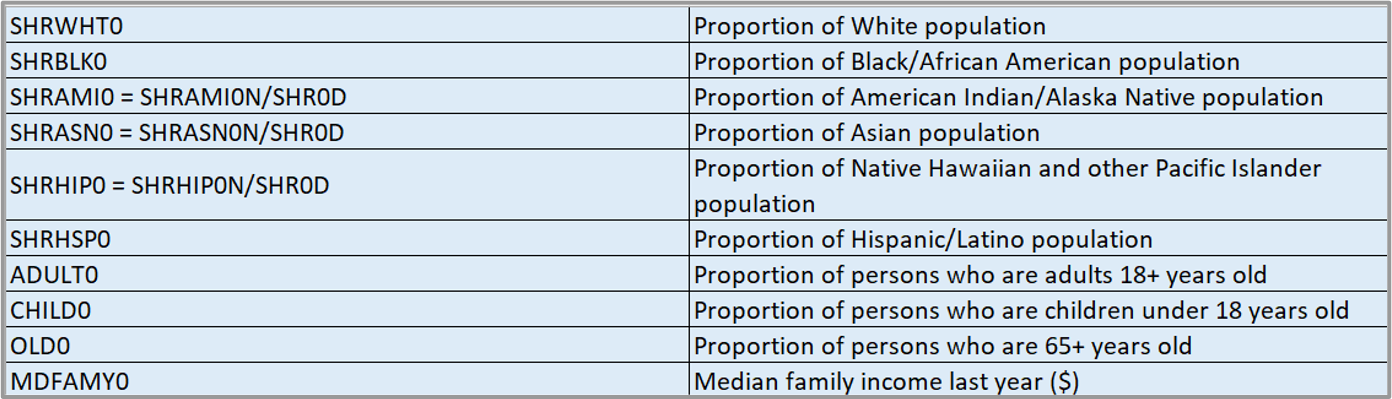
People Variables:
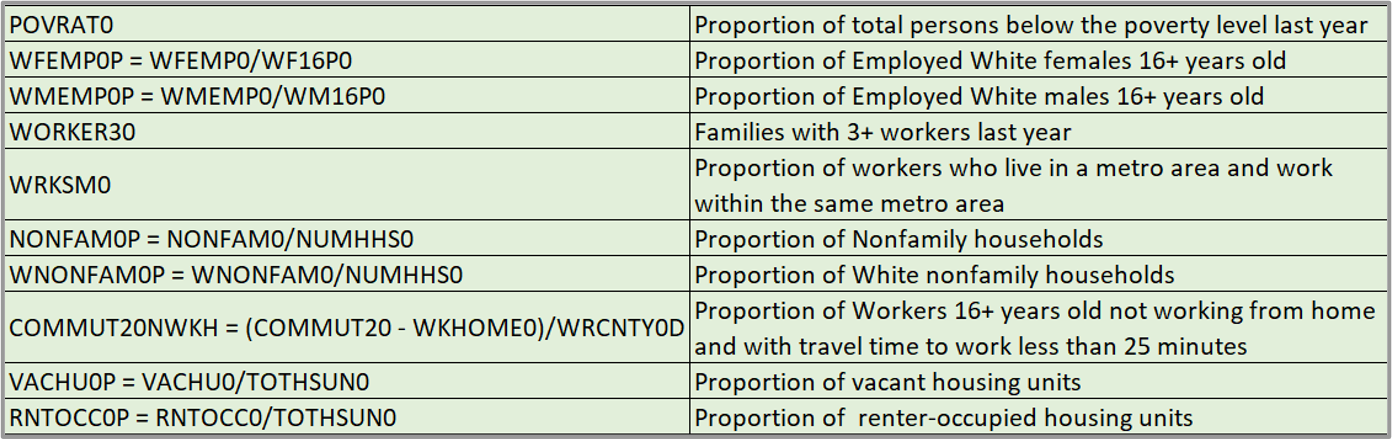
Place Variables:
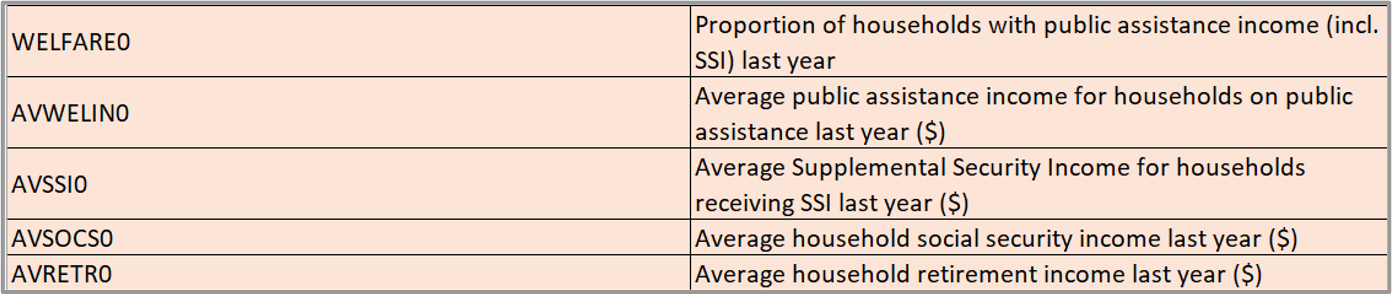
Policy Variables:
Analysis: Modeling
Normalized the variables that were not in proportion
Built a logistic regression model
Identified the significant variables out of all the predictors
Used the identified variables to build a random forest classifier
Used ADASYN (Adaptive Synthetic Sampling) technique to artificially generate more data of the minority class
Used the balanced dataset to build a random forest classifier
Analysis: Results
People Factors: Race and median family income were found to be significant in both the NY and LA metro areas. In NY MSA, the proportion of 65+ years was found to be significant, whereas in LA MSA, the proportion of children under 18+ to be significant.
Place Factors: In both MSAs, commuting patterns - specifically, proportion of population working within the same metro area to be significant. NY also shows significance in commute times under 25 minutes. Additional NY-specific factors include proportion of nonfamily households, proportion of employed white females, and proportion of vacant and rental households. In LA, the proportion of people under the poverty level was found to be significant.
Policy Factors: No policy-related variables tested were found to be statistically significant in either metro area.
Analysis: Results
For the NY MSA, the Random Forest classifier achieved 77.6% accuracy and an F1 Score of 0.16 without data resampling.
For the NY MSA, the Random Forest classifier achieved 71.8% accuracy and an F1 Score of 0.38 with data resampling.
For the LA MSA, the Random Forest classifier achieved 76.3% accuracy and an F1 Score of 0.15 without data resampling.
For the LA MSA, the Random Forest classifier achieved 72.0% accuracy and an F1 Score of 0.40 with data resampling.
Resampling led to a substantial improvement in the model's ability to detect the minority class, with F1 Scores increasing by approximately 150% for both the NY and LA MSAs, despite a slight drop in overall accuracy.
Applications
Policy: This prediction method can help policymakers identify neighborhoods at risk of displacement early, allowing them to implement targeted affordable housing initiatives and tenant protection measures before crises escalate.
Small Business: It can help small businesses anticipate shifts in neighborhood demographics and economic conditions, enabling them to adapt their products, services, and marketing to better serve changing communities and sustain growth.
Real Estate: It can help developers pinpoint emerging neighborhoods with growth potential, supporting strategic and responsible investment decisions that balance profit with community needs.
Retail & Services: It can help retail chains and service providers plan optimal store locations and tailor marketing strategies to align with projected demographic and economic trends.
Financial Services: It can help banks and lenders evaluate risks and identify opportunities in lending and financing, based on neighborhood transformation forecasts.
© Untitled. All right reserved.